Article Summary
Three-tiered framework for measuring AEO campaigns: Visibility (leading indicators like Brand Mention Rate), Conversions (tracking LLM Referral Traffic and Conversions, which convert at higher rates than organic search), and Pipeline and Revenue (LLM-Sourced Revenue and Blended Organic Lift). Optimist’s clients have successfully used this approach to track significant growth, including a 49x increase in LLM referral revenue over 14 months.
The metrics for AEO campaigns fall into three tiers: visibility metrics showing whether AI models mention and cite your brand, conversions metrics tracking AI-referred leads and form fills, and pipeline metrics connecting AEO to revenue.
Why Most AEO Measurement Is Broken
The Answer Engine Optimization measurement conversation has a blind spot. Open any guide on “how to measure AEO,” and you will find the same list: Brand mention rate, visibility score, share of voice.
These are fine metrics. They are also, on their own, incomplete.
Visibility metrics are leading indicators. They tell you whether AI models know your brand exists.
They do not tell you whether that visibility is generating pipeline, closing deals, or contributing a single dollar of revenue.
Optimist’s AEO clients have tracked 49x growth in LLM referral revenue over 14 months, 8x LLM conversions in 8 months, and 13x LLM-sourced revenue year over year.
These AEO case studies exist because the measurement went beyond visibility.
They required tracking engagement, attribution, and actual revenue flowing from AI-driven discovery.
The parallel to early SEO is worth noting. The SEO industry spent years measuring rankings, then traffic, before anyone built a reliable connection to pipeline and revenue. (Optimist has written about content marketing KPIs and the ROI of SEO that informed this evolution.)
AEO measurement is at the “rankings” stage right now.
The frameworks most teams use were designed for a channel that barely existed 18 months ago, and they have not caught up to what AEO actually delivers.
Tier 1: Visibility Metrics (Leading Indicators)
Visibility metrics answer the foundational question: Is your brand showing up in AI responses?
These are the starting point for any AEO measurement program.
AI Brand Mention/Recommendation Rate or Brand Visibility Score
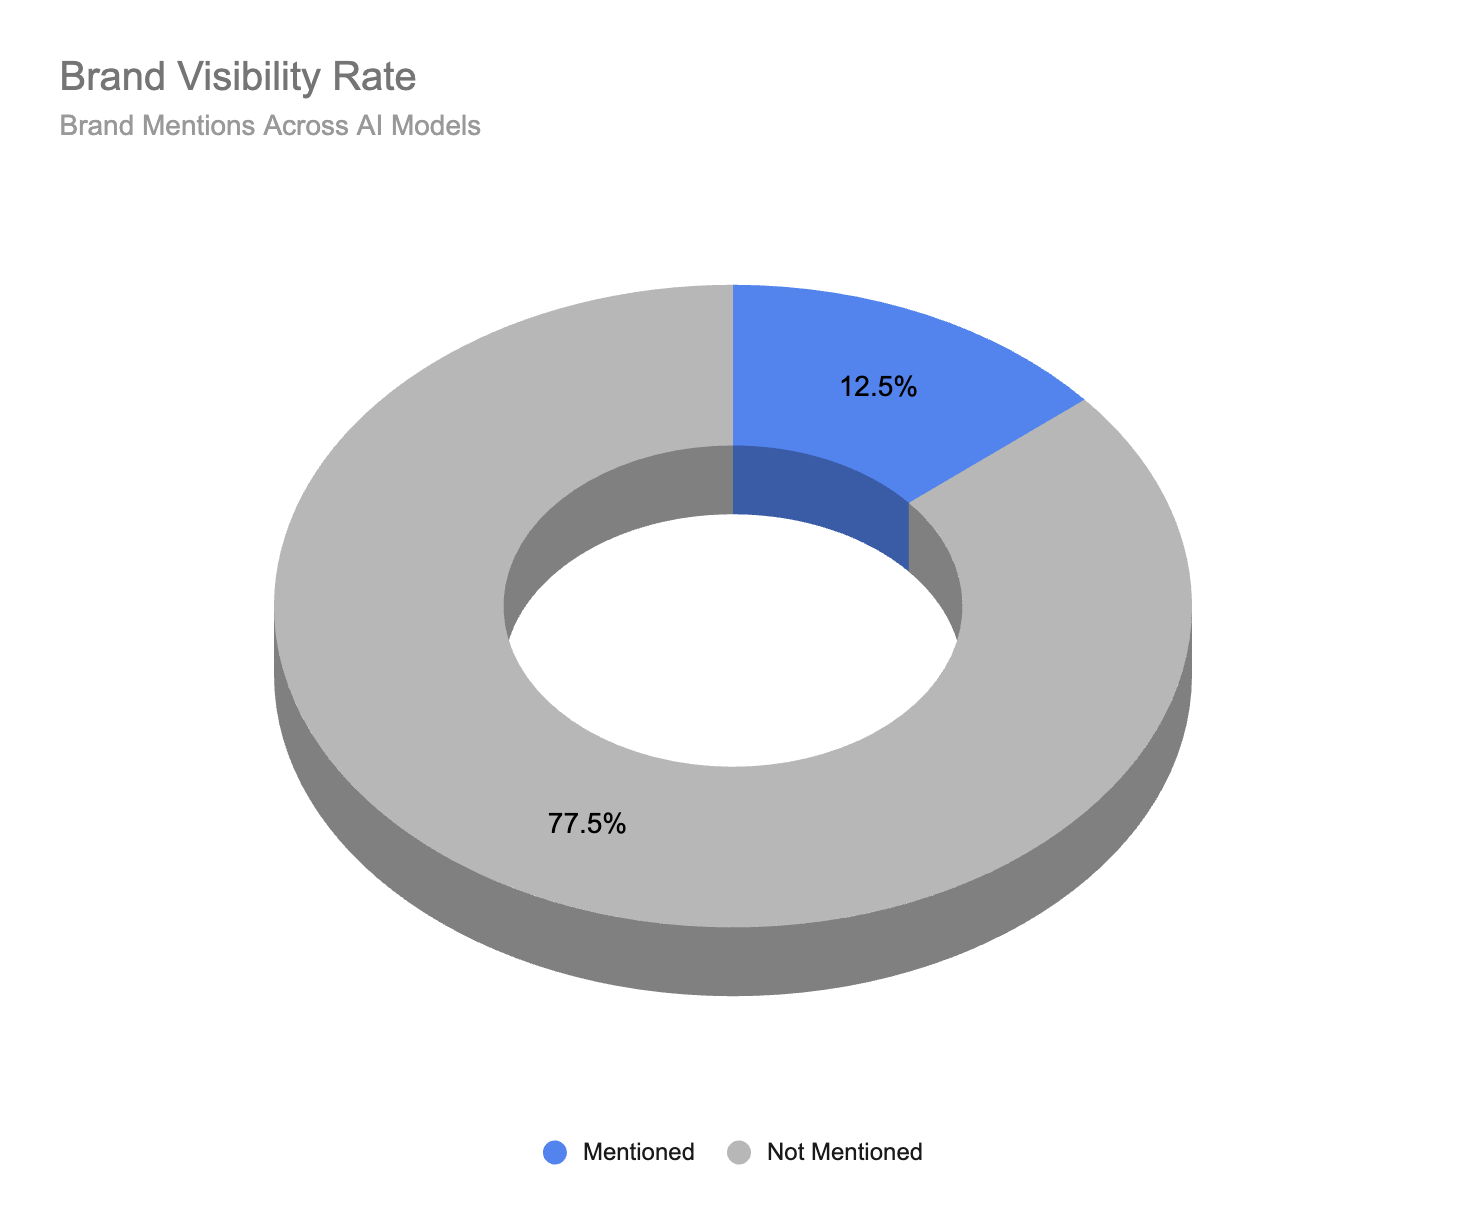
Brand mention rate is the percentage of relevant queries where your brand appears in AI-generated answers.
If you run 50 buyer-intent prompts across ChatGPT, Perplexity, Claude, and Gemini, and your brand shows up in 12 of those responses, your brand mention rate is 24%.
This is the most commonly tracked AEO metric, and for good reason. It establishes whether your brand is being picked up at all.
This is also sometimes called brand visibility score and in some cases it’s combined with citation rate to capture how frequently your brand is visible in either context.
Citation Rate or Citation Frequency
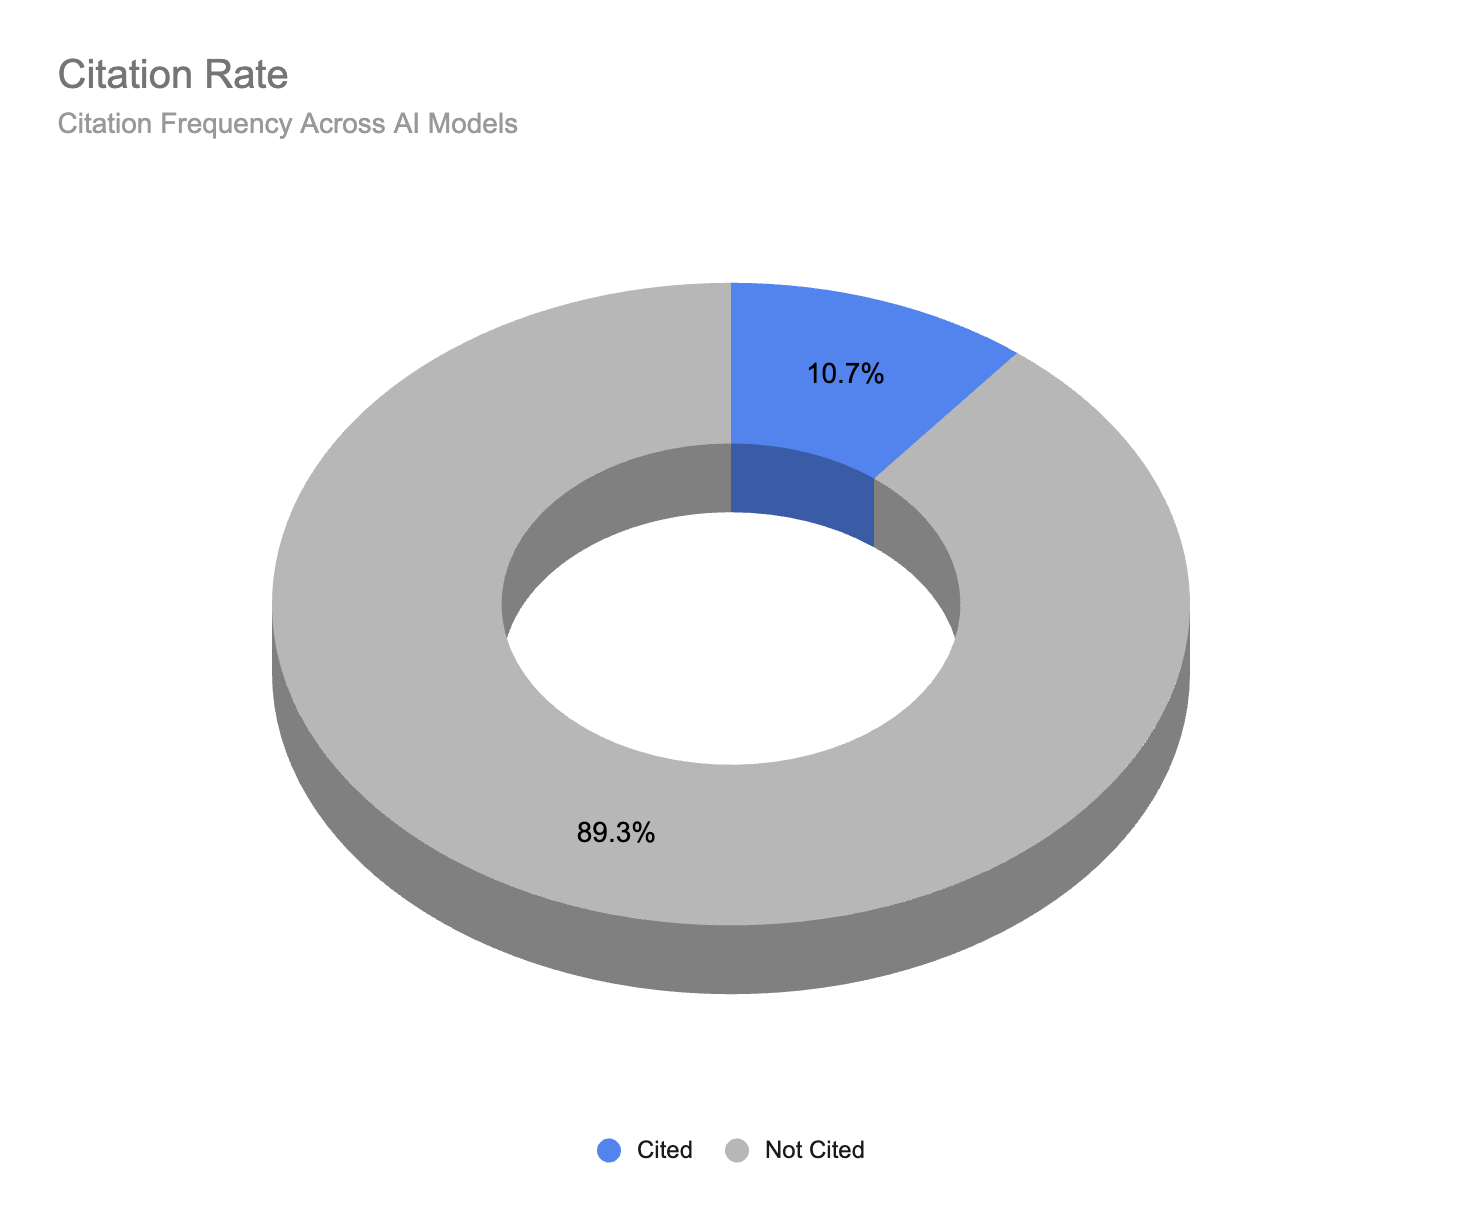
Another way to benchmark your brand’s visibility in AI models is to look at how frequently pages on your site are cited as sources within LLM responses.
This generally means the response includes a link to a specific page or article on your website.
Sometimes, citations accompany a brand mention. Other times, it’s simply referenced as a source as part of the response.
For this reason, citations should be considered a secondary visibility metric. While citations can be valuable and may lead to increased referral traffic, the links themselves are often not as valuable or as visible as a direct brand mention or recommendation.
Share of Voice (Share of Answer)
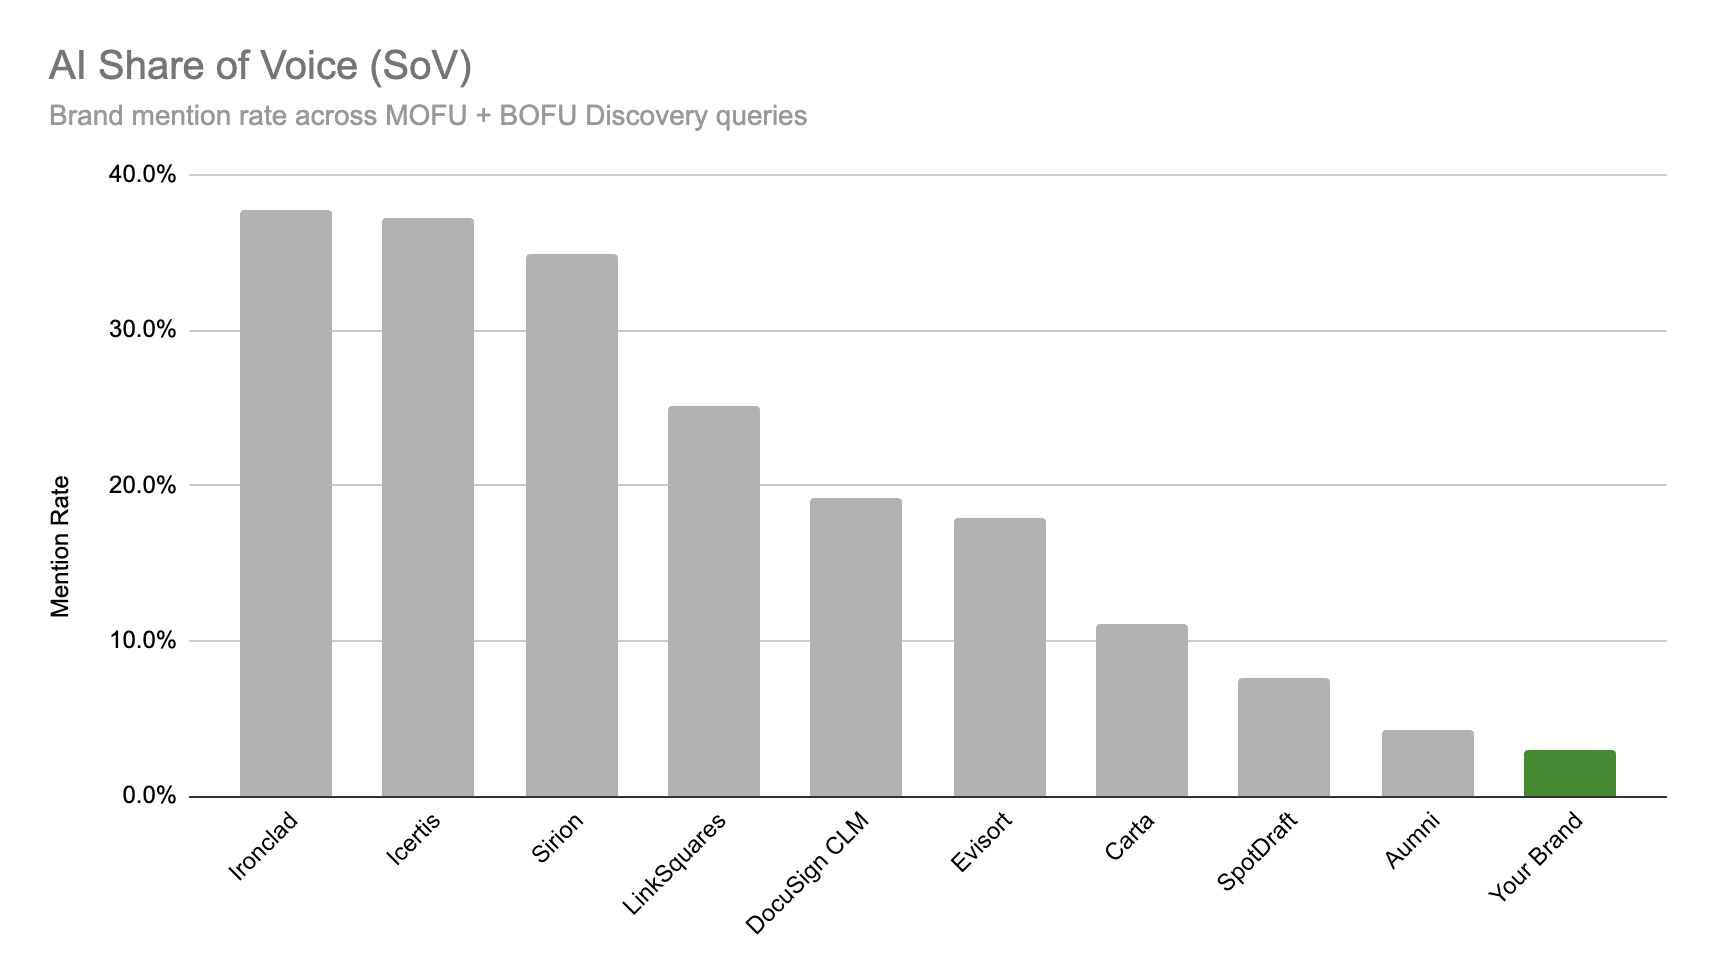
Share of voice or share of answer measures your brand’s presence relative to competitors in AI responses.
If a buyer asks “what are the best AP automation tools for mid-market companies” and ChatGPT names five brands including your own, your share of answer is 20%.
This metric becomes more useful when tracked over time against named competitors.
Many brands prefer to track SoV rather than simple Brand Mention rates because it provides a relative context to understand your performance. For example, is a 20% recommendation rate good or bad? This will depend on your industry and the prompts you’re tracking.
Share of Voice allows you to benchmark your visibility versus competitors to see how you compare.
Recommendation Position
Recommendation position tracks where your brand appears in the answer, for example in a list of recommended tools or solutions.
First mention carries more weight than a passing reference in a list of alternatives. If your brand consistently appears as the third or fourth option, that is a different signal than being named first.
But there’s a catch.
Analysis by SparkToro and Gumshoe.ai shows that LLMs are inconsistent in their rankings. Their data showed there is about 0.07 – 0.24% (less than 1%) chance that any 2 prompts will return the same list of recommendations in the same order.
So, I wouldn’t recommend that you bother tracking position. It will simply add noise to an already complex measurement process.
Brand Accuracy
Brand accuracy measures whether AI models describe your brand correctly.
This one gets overlooked constantly, and it might be the most important metric in Tier 1.
Being mentioned is only valuable if the description matches your actual positioning, capabilities, and category. A fintech company being described as a “general accounting tool” in AI responses has a brand accuracy problem that visibility metrics alone will not surface.
Every inaccurate mention could be actively sending buyers elsewhere.
| Metric | What It Measures | How to Track | Cadence |
| Brand mention rate | % of target prompts with brand mention or recommendation | Prompt library across 4-5 AI models | Monthly |
| Citation rate | Frequency of citations pointing to your website | Profound, Peec, Scrunch, or manual testing | Monthly |
| Share of voice | Brand presence vs. competitors | AIclicks, Ahrefs Brand Radar, manual testing | Monthly |
| Recommendation position | Where brand appears in the answer | Manual prompt testing | Monthly |
| Brand accuracy | Correctness of brand description in AI | Manual review + scoring rubric | Monthly |
How to Set Up Visibility Benchmarking
Start with a prompt library.
Build a list of 20 to 50 queries that represent how your buyers actually search for solutions in your category. These should mirror real buyer language, not marketing terms.
“What’s the best project management tool for remote engineering teams of 10-50” is a buyer prompt.
“Top SaaS PM solutions” is a marketer prompt.
Note: There’s not really a “right prompt” to track. AI models are probabilistic, they have memory, and they consider each user’s individual context when generating responses.
So it’s impossible to perfectly mirror 1:1 the prompts and responses real users are seeing.
Instead, just focus on tracking close approximations in a variety of contexts. And track the same prompts consistently over time to understand the changes.
It’s okay to use synthetic prompts (e.g., AI-generated prompts) as a proxy for what real users are seeing.
Test that library monthly by running the same prompts through ChatGPT, Perplexity, Claude, Gemini, and Google AI Overviews. Record whether your brand is mentioned, where it appears in the response, and whether the description is accurate.
Track the same prompts against three to five named competitors to see relative SoV.
Tools like Profound, Peec, and Scrunch automate parts of this process. Ahrefs Brand Radar provides competitive visibility data.
For teams on a tight budget, automated manual prompt tracking in a spreadsheet works.
It takes time, but the data can be just as valid if it’s collected consistently.
What Visibility Metrics Can and Cannot Tell You
Visibility is necessary but not sufficient.
AI visibility metrics can tell you if, where, and how you appear.
But it cannot tell you whether AEO is driving pipeline. A brand can have a 60% mention rate across target prompts and still generate zero attributable revenue from AI search.
That gap is where Tier 2 and Tier 3 come in.
Tier 2: Conversion Metrics
Engagement metrics bridge visibility and revenue.
They answer a different question: Is AI-driven discovery actually sending people to your site, and what do they do when they arrive?
LLM Referral Traffic
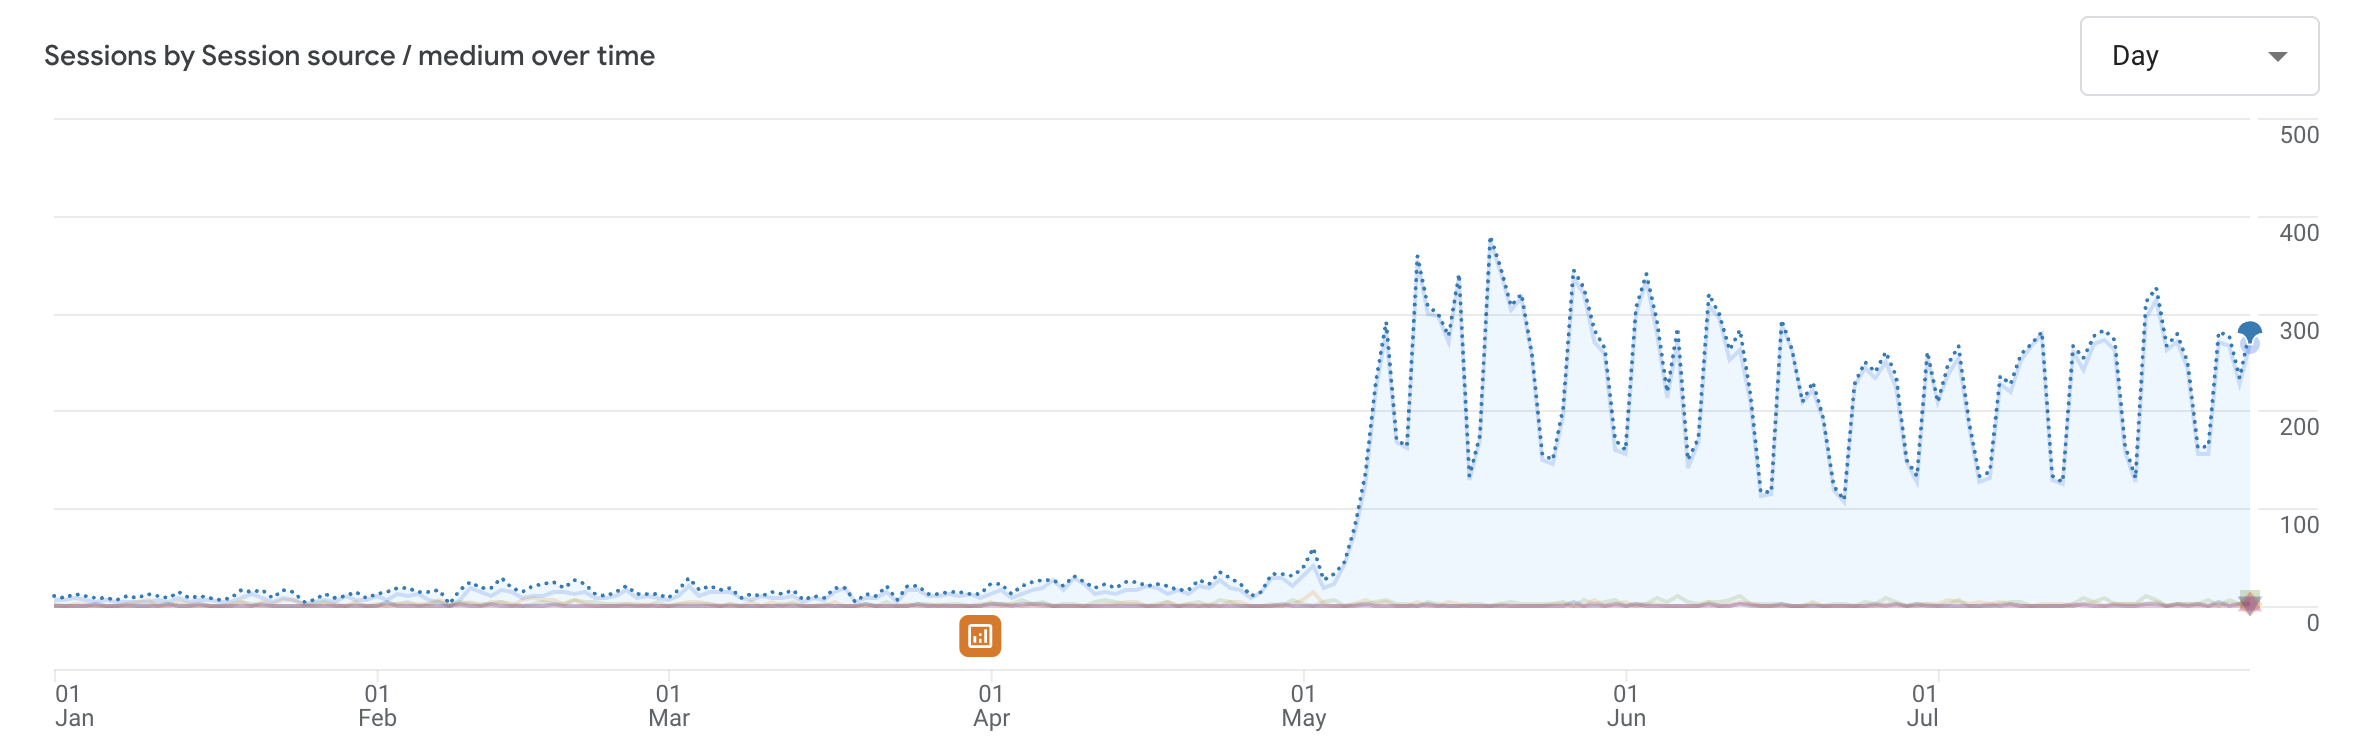
LLM referral traffic tracks sessions from AI sources in GA4 or your analytics platform of choice.
This includes visits from ChatGPT, Perplexity, Claude, Gemini, and Google AI Overviews.
According to Conductor’s 2026 AEO/GEO Benchmarks Report, AI platforms generated 1.13 billion referral visits in June 2025 alone, a 357% increase year over year. ChatGPT accounts for 87.4% of all AI referral traffic across the industries studied.
LLM Referral Conversion Rate
LLM referral conversion rate measures how AI-referred visitors convert compared to other sources. This is where the data gets interesting.
According to Seer Interactive’s analysis, ChatGPT traffic converts at 15.9%, compared to 1.76% for Google organic search. Ahrefs reported that AI visitors accounted for 12.1% of signups from just 0.5% of total traffic, a 23x conversion advantage.
And Semrush found that AI search visitors are 4.4 times more valuable than traditional organic visitors.
Three independent data sources pointing in the same direction: AI-referred traffic converts at higher rates than organic search.
Buyers who arrive from an AI recommendation have already done their research inside the conversation. By the time they click, they have context, they have intent, and they are further down the buying process than a typical organic visitor.
AI-Referred Conversions
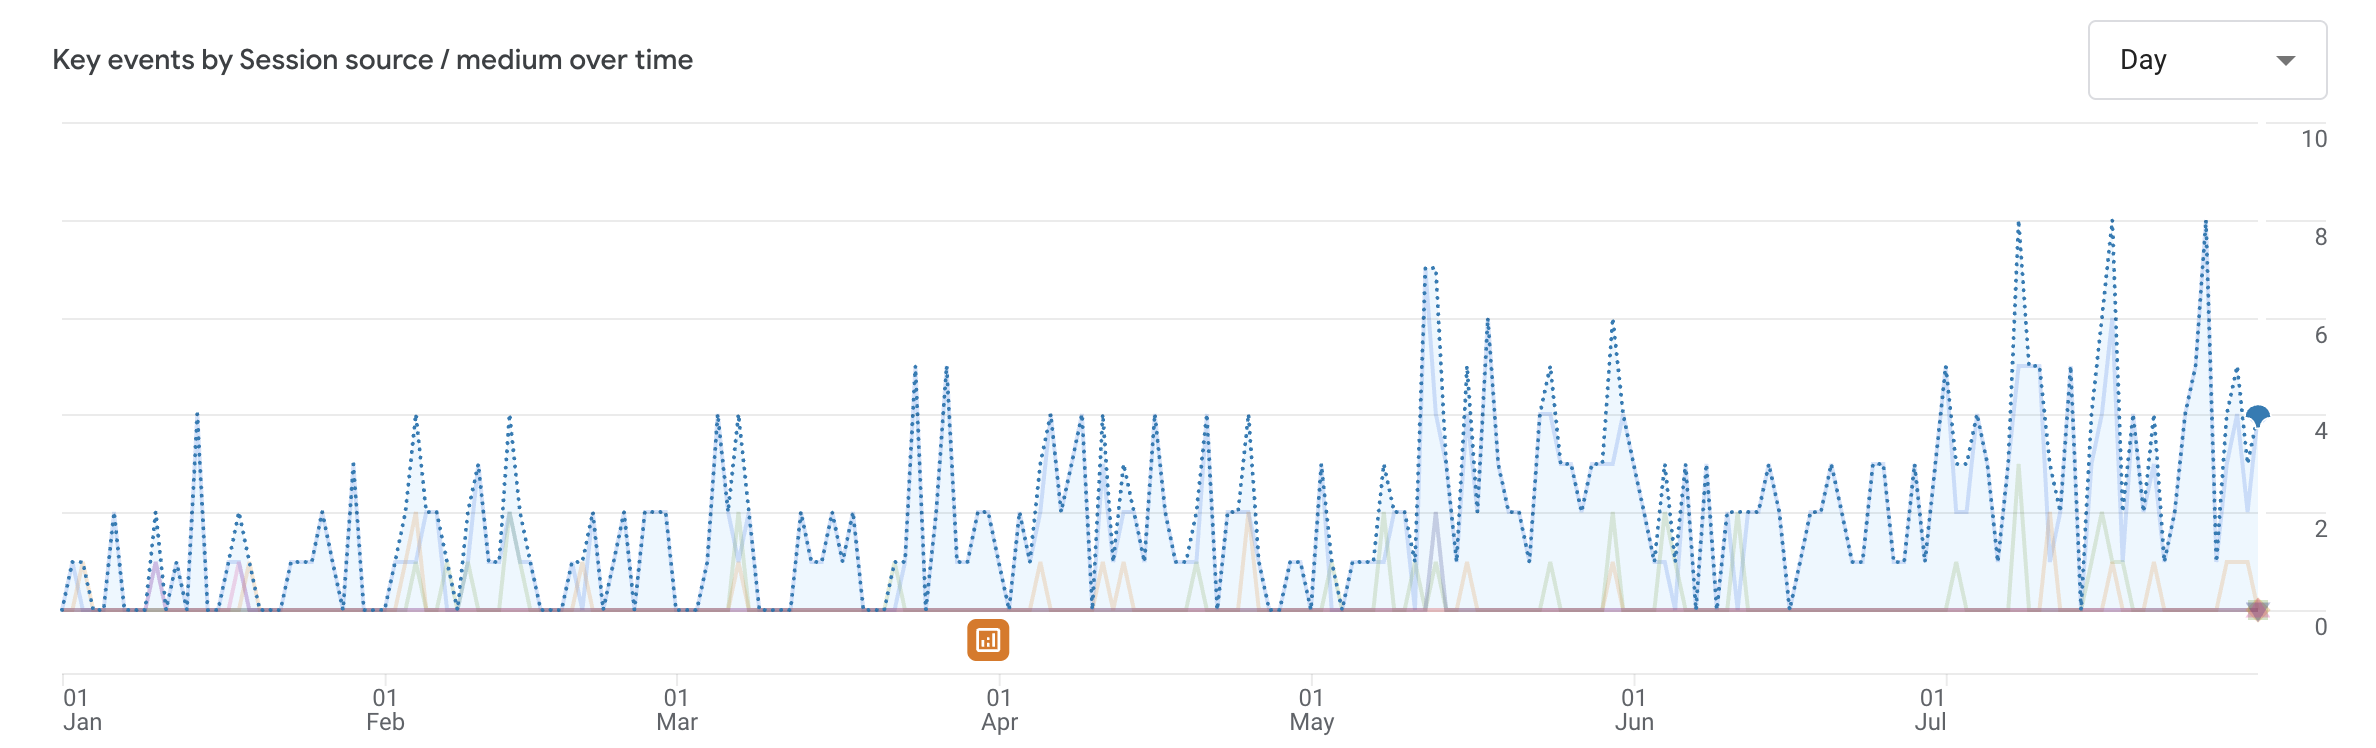
AI-referred conversions track the specific actions AI visitors take. Demo requests, signups, MQLs, content downloads. This is where engagement connects to pipeline.
Tracking conversions directly generated from LLM referrals is one of the keys to capturing the value of AEO work.
Setting Up LLM Referral Tracking in GA4
Create a custom channel grouping in GA4 that captures AI referral sources. The setup involves three steps:
- Build a traffic segment with source conditions matching “chatgpt.com,” “perplexity.ai,” “claude.ai,” “gemini.google.com,” and “google” where medium equals “referral” or the source matches AI Overview patterns. ChatGPT traffic may also appear with source “android-app” or “direct” from the in-app browser, so monitor for evolving attribution patterns. (Pro tip: Build a simple RegEx to match all of the referral patterns of the major LLMs)
- Create a custom channel grouping called “AI Referral” that aggregates all AI sources into a single reporting view. This gives you a clean comparison: AI Referral vs. Organic Search vs. Paid vs. Direct.
- Set up event tracking for conversions from AI-referred sessions. Map the specific actions that matter to your pipeline (form submissions, demo requests, trial signups) and compare conversion rates between AI Referral and other channels.
Tier 2.5: Correlated or Influenced Conversion Metrics
But, wait.
What if a user sees your brand in ChatGPT and then Googles your or types your URL into their address bar directly, without clicking a link in the chat?
They won’t show up as an LLM referral in GA4. That activity will show up as direct traffic or maybe organic search traffic from a branded query.
When we started measuring AEO for B2B clients at Optimist, the first thing that became clear was that existing metrics frameworks were built for brands direct-conversion models.
B2B doesn’t work that way.
A buyer sees your brand recommended in ChatGPT, then shows up three weeks later through a direct visit or branded search. If you are only tracking LLM referral clicks, you are missing most of the value.
This is the AI dark funnel (or “dark search”).
It’s the same phenomenon that made social media attribution unreliable for years, now replicated in AI search. The buyer was influenced by an AI recommendation, but the attribution data shows “direct” or “branded search” as the source.
Correlated Direct & Branded Search
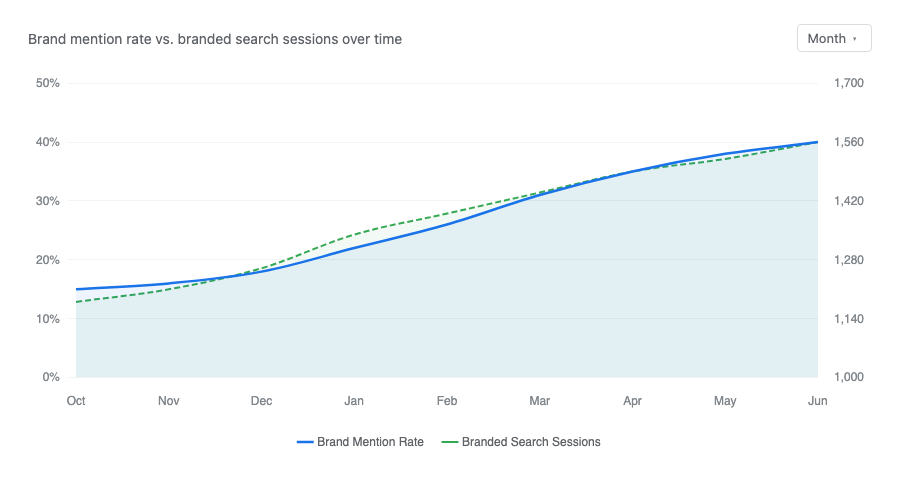
If your visibility increases across AI surfaces, one effect that should have is an increase in direct traffic (people who type or paste your website directly into their browser) and branded search traffic (people searching for you by name).
Correlation analysis looks for statistical relationships between AEO visibility improvements and increases in direct traffic, branded search volume, and demo requests.
If brand mention rate rises from 15% to 40% over three months and branded search traffic increases 30% in the same period, the correlation is a strong signal of AI-driven demand.
We recommend brands measure their branded search traffic and direct traffic (as well as associated conversions) to see the full impact of AI search optimization work.
Self-Reported Attribution
Self-reported attribution is the simplest and most effective way to capture more data on AI’s influence on conversions and revenue.
Add “How did you hear about us?” to your demo request or contact form
This captures intent that no tracking pixel can see.
When a prospect selects that option, you have a direct signal that AI search influenced their decision, regardless of what GA4 recorded as the referral source.
Qualitative signals from sales conversations fill the gaps that quantitative methods miss.
When SDRs start reporting that prospects mention “I saw you recommended in ChatGPT” or “Perplexity told me about you,” that is qualitative confirmation that AEO is driving real pipeline, even if the attribution data does not capture it cleanly.
The GA4 referral numbers often look modest, then you add a “how did you hear about us” field and half your demo requests say ChatGPT.
If your attribution stack doesn’t include correlated and self-reported data, you’re seeing a fraction of the real picture.
Tier 3: Pipeline and Revenue Metrics (Business Outcomes)
This is the tier that determines whether AEO is a line item on a dashboard or a revenue channel worth investing in.
LLM-Sourced Revenue
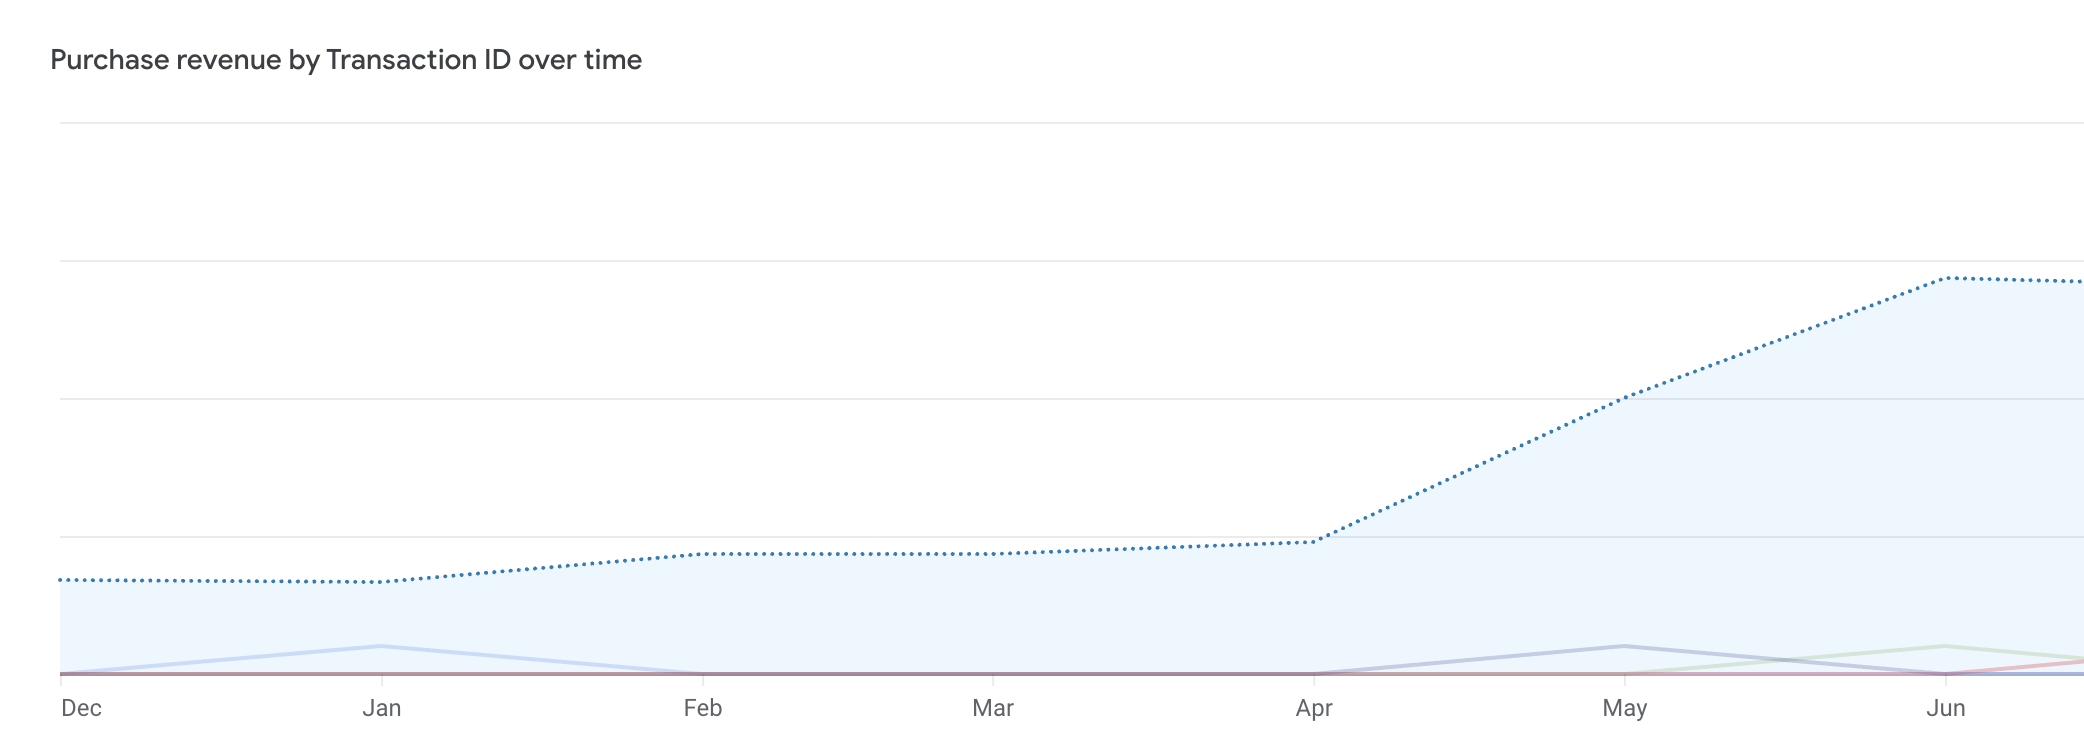
LLM-sourced revenue is the direct attribution metric.
Revenue from deals where the first touch or a significant touchpoint came from an AI referral. This requires GA4 conversion tracking connected to your CRM or sales/revenue data. When a prospect arrives from ChatGPT, requests a demo, enters the pipeline, and closes, that revenue is directly attributable to AEO.
Optimist’s B2B technology client tracked 49x growth in LLM referral revenue, a 4,900% increase, over 14 months. That number is direct attribution. It flows from tracked AI referral sessions through to closed revenue in the CRM.
LLM-Influenced Pipeline
LLM-influenced pipeline captures deals where AI touchpoints appeared somewhere in the buyer journey, even if AI was not the first or last touch.
Multi-touch attribution models in tools like Dreamdata or HubSpot can surface these patterns if CRM source fields are properly mapped.
Blended Organic Pipeline
Blended organic lift is the metric that captures the full picture.
Total organic pipeline growth (organic search plus AI referral combined) after AEO implementation. This single number accounts for the dark funnel, the branded search halo effect, and the reinforcement loop between SEO and AEO.
For Optimist’s AEO clients, the most honest metric has proven to be blended organic pipeline.
Total pipeline from organic search plus AI referral, measured as a combined number. The channels reinforce each other, and the measurement should reflect that.
A buyer might discover your brand through a ChatGPT recommendation, search your name in Google, read three blog posts over two weeks, and then request a demo.
Was that an AEO-sourced deal or an SEO-sourced deal? It was both.
The organic channel, across search and AI surfaces, drove the pipeline. Measuring it as one number gives you an accurate view of the total return on your organic investment.
This is how Optimist measures AEO for clients. Not just LLM referral traffic in isolation, but the total pipeline impact of the integrated AEO plus SEO program. That blended number is what goes into the quarterly business review, and it is the number that determines whether the investment continues.
Direct Attribution: What GA4 and Your CRM Can See
The direct attribution path is the clearest to measure. LLM referral visit, conversion event, CRM lead, opportunity, closed deal, revenue.
Setting it up requires three things:
- GA4 with AI channel grouping: To identify which conversions came from AI referral sessions
- CRM source field mapping: So the original source carries through from marketing automation to the sales pipeline
- First-touch and multi-touch attribution models: Because B2B buying involves multiple stakeholders and touchpoints, and a single-touch model will either overcount or undercount AI’s contribution
The AEO Measurement Stack: Tools and Setup
The tools you need depend on what you are measuring. Here is a practical breakdown by tier.
| Category | Free / Low-Cost Options | Paid Tools | What It Tracks |
| Visibility monitoring | Manual prompt testing (spreadsheet) | Profound, Peec, Scrunch, Ahrefs Brand Radar | Brand mention rate, share of voice, brand accuracy |
| Traffic attribution | GA4 with custom channel grouping | Conductor, Dreamdata | LLM referral traffic, AI-referred conversions |
| CRM integration | HubSpot (free tier) self-reported attribution field | Salesforce, HubSpot (paid), Dreamdata | Source mapping, multi-touch attribution, pipeline tracking |
| Reporting | Google Sheets, Looker Studio | Databox, custom dashboards | Combined visibility + engagement + pipeline view |
Budget reality check: A team with no budget can start measuring AEO today.
Manual prompt testing across four AI models takes two to three hours per month. GA4 is free. Adding a self-reported attribution field to your forms is free. These three actions cover the basics of all three tiers.
Paid visibility tools become valuable once you need to track more than 50 prompts or monitor changes across competitors at scale. CRM-level attribution tools matter once your AI referral volume is large enough to justify pipeline-level tracking.
Reporting cadence
Many paid AI visibility tracking tools offer daily visibility checks and reporting.
I think that’s overkill.
Visibility metrics should be tracked week over week, which aligns with changes that often reflect in AI responses within a 2-4 day window. This keeps it tight enough to track execution to impact but you’re not staring at minute-by-minute stats trying to see a pattern.
Conversion and traffic metrics warrant monthly review.
Pipeline and revenue metrics should be reported quarterly, aligned to standard B2B planning cycles. AEO is a compounding channel, and evaluating it on shorter cycles will understate its trajectory.
AEO Measurement by Maturity Stage
Not every metric matters from day one. Trying to build full pipeline attribution before you have basic visibility tracking in place creates complexity without clarity.
Stage 1: Baseline (Month 0 to 1)
Run your initial visibility benchmark: Build the prompt library, test across four to five AI models, and record your starting brand mention rate and share of voice.
Set up GA4 with a custom AI Referral channel grouping.
Add a self-reported attribution question to your primary conversion forms. At this stage, you are establishing the baseline that everything else will be measured against.
Stage 2: Early Optimization (Months 2 to 4)
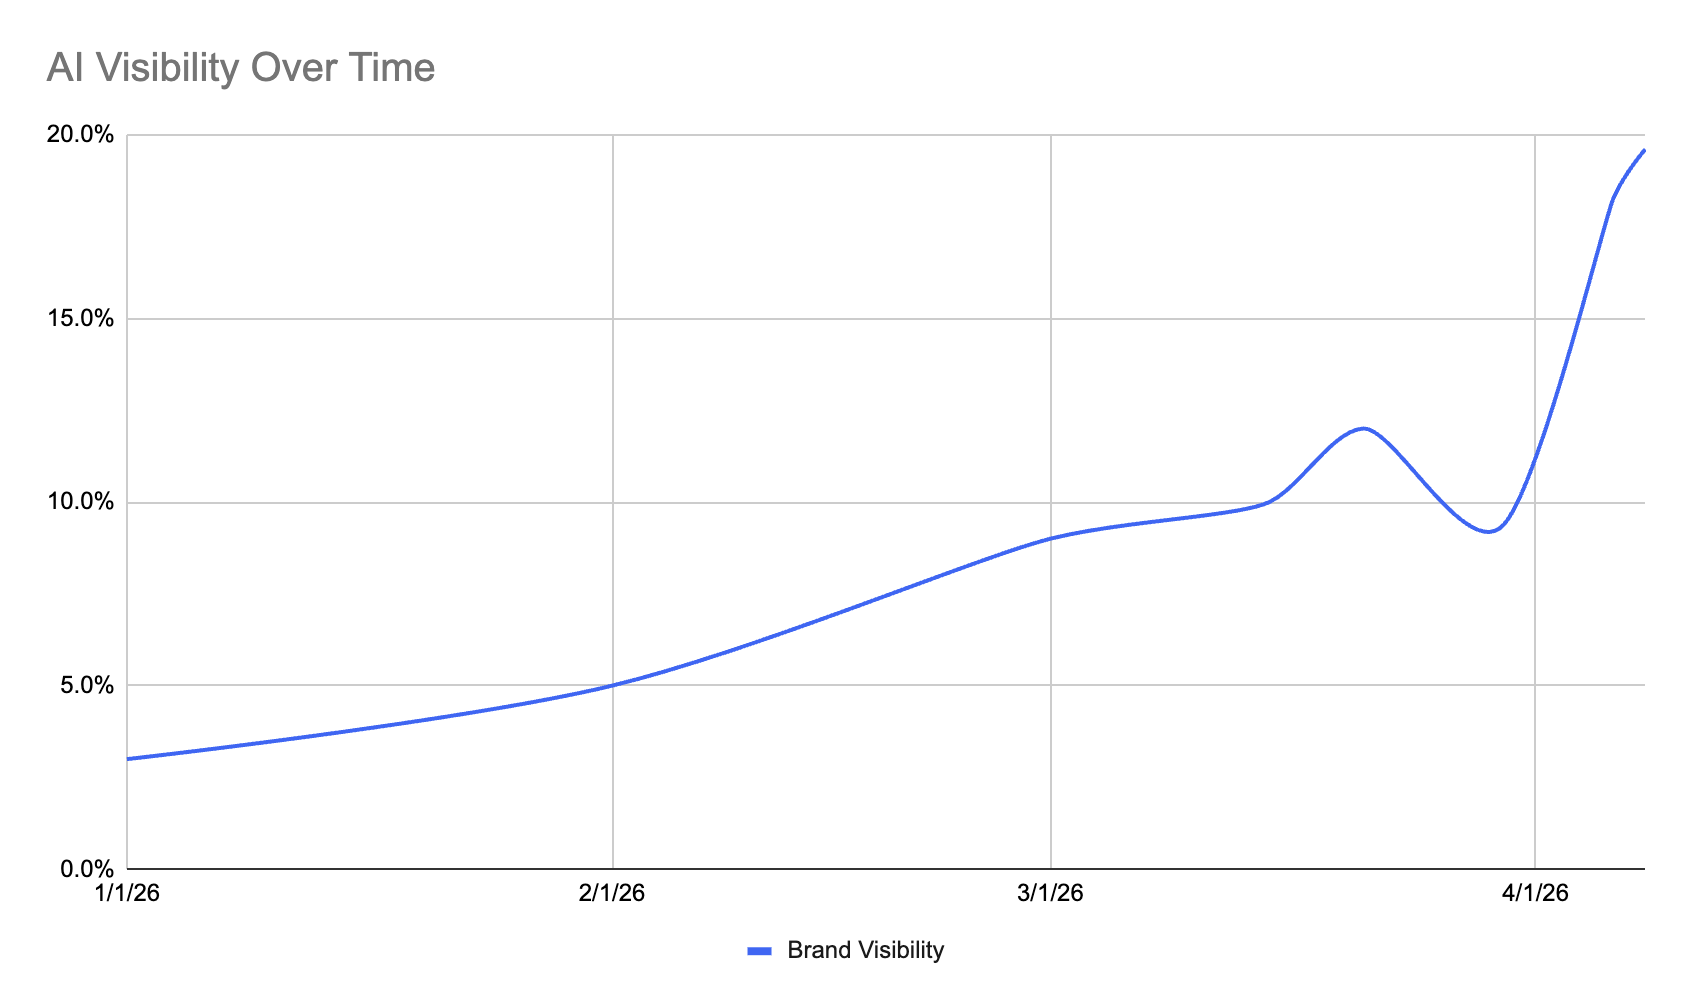
Track brand mention rate trends weekly.
Are your AEO optimizations moving the needle on visibility?
Monitor LLM referral traffic growth in GA4.
Begin mapping AI referral sources in your CRM so the data infrastructure is ready for pipeline tracking. Most teams will see initial visibility movement in this window if their AEO work is solid.
Stage 3: Pipeline Connection (Months 4 to 8)
Start measuring LLM-sourced conversions as a distinct metric.
Compare AI-referred lead quality against other channels. Run your first correlation analysis between visibility improvements and pipeline metrics.
This is the stage where AEO shifts from “interesting experiment” to “measurable channel.”
Stage 4: Revenue Attribution (Months 8 and beyond)
Full pipeline attribution is in place: Direct and influenced.
Blended organic lift measurement is running.
You can compare customer lifetime value by acquisition source and show the total revenue impact of the AEO plus SEO program. At this stage, AEO has its own line in the budget conversation, justified by the same revenue metrics as every other channel.
Frequently Asked Questions About AEO Measurement
How do you measure AEO success?
Measure AEO success starting with visibility (are AI models citing your brand?), then engagement (is that visibility driving traffic that converts?), then pipeline (is it generating actual revenue?). Most teams stop at visibility: brand mention rate, share of voice, brand accuracy. That is table stakes. The metric that determines whether AEO is worth the investment is pipeline impact: LLM-sourced revenue, AI-influenced pipeline, and blended organic lift. If your AEO dashboard does not have a revenue line, keep building.
What is brand mention rate in AEO?
Brand mention rate is the percentage of relevant queries where your brand is mentioned or recommended in AI-generated responses. To benchmark it, build a prompt library of 20 to 50 buyer-intent queries, test them monthly across ChatGPT, Perplexity, Claude, Gemini, and Google AI Overviews, and track the percentage where your brand appears. Compare against three to five named competitors to understand your relative position.
How do you track AI referral traffic in GA4?
Create a custom segment in GA4 with source conditions matching chatgpt.com, perplexity.ai, claude.ai, and gemini.google.com, with medium set to referral. Group these into a custom channel called “AI Referral” for clean reporting.
Then set up event tracking for your key conversion actions (demo requests, signups, form submissions) so you can measure conversion rates from AI-referred sessions against other channels.
What tools track AEO performance?
For visibility monitoring, Profound, Peec, Scrunch, and Ahrefs Brand Radar automate prompt testing and competitive tracking. For traffic attribution, GA4 with custom channel grouping is the baseline, and Conductor offers dedicated AI traffic reporting. For pipeline attribution in B2B, Dreamdata, Salesforce, or HubSpot with proper source field mapping connect AI referrals to revenue. Manual prompt testing in a spreadsheet remains a viable free option for teams starting out.
How long does it take to see AEO results?
Early visibility signals of AEO growth, such as changes in brand mention rate and share of voice, typically appear within two to three months of solid AEO work. Measurable conversion impact (AI-referred signups, demo requests) usually follows in the four to eight month range. Revenue attribution compounds from eight months onward as pipeline data matures (depends on your sales cycle). Optimist’s fintech client achieved 8x growth in LLM conversions within eight months, providing a realistic benchmark for B2B teams.
Is AEO measurable as a revenue channel?
Yes, you can measure revenue from AEO the right setup. GA4 AI channel grouping, CRM source mapping, self-reported attribution, and blended organic pipeline tracking make AEO as measurable as any demand generation channel. Optimist’s B2B technology client tracked 49x growth in LLM referral revenue over 14 months. The data infrastructure exists. Most teams just have not built it yet.
