Article Summary
A SaaS growth strategy compounds acquisition, retention, and expansion into pipeline. With median private SaaS growth compressed to 25% and distribution the only durable moat, the 2026 playbook picks one or two motions to compound at the company’s stage — organic inbound, PLG, pricing, or retention — and Optimist’s CORE Analysis identifies which motion fits.
The 2026 reality for SaaS growth is harsh.
Median private B2B SaaS growth has compressed to 25%, per SaaS Capital’s 2025 benchmark of 1,000+ companies. CAC keeps climbing. VC capital allocation has inverted from 70/30 product-to-GTM five years ago to roughly 30/70 today, per Paddle’s 2025 analysis.
Plus product and feature parity is the default operating reality.
All of this means distribution is the only remaining moat for SaaS businesses.
SaaS growth strategy is all about building a system of acquisition, retention, and expansion motions that compound into predictable pipeline and revenue. Generally, focusing on 2-3 key levers and focusing on long-term strategies get cheaper per dollar of ARR over time.
What “Good” SaaS Growth Looks Like in 2026
Good growth in 2026 means a Rule of 40 above 40%, NRR above 110%, and CAC payback under 12 months, measured against the median for the specific ARR band.
The benchmarks reset every year, and 2026’s are tighter than 2023’s.
Growth rate by ARR band
SaaS Capital’s 2025 benchmark of 1,000+ private B2B SaaS companies puts the overall median annual growth at 25%, with bootstrapped companies at 23% median and equity-backed companies at 25%.
Companies in the highest NRR tier post median growth 83% above the population median.
For bootstrapped companies in the $3M to $20M range, the 2026 SaaS Capital bootstrapped benchmark puts the median at 15%, with the 90th percentile at 42.3%.
Net Revenue Retention
Best-in-class public SaaS now averages 120 to 125% NRR, according to FE International’s 2026 NRR analysis.
NRR by segment runs 118% at enterprise (>$100K ACV), 108% at mid-market, and 97% at SMB. SaaS companies with high NRR grow 2.5x faster than their low-NRR counterparts, per High Alpha’s 2025 NRR analysis.
CAC payback period
According to Benchmarkit’s 2025 metrics report, B2B SaaS median CAC payback has risen 12.5% since 2022. But the physics of CAC payback remains fairly steady.
Under 12 months is healthy.
Over 24 months reads as capital-inefficient and triggers serious board questions.
LTV:CAC
Conventional wisdom pegs a healthy LTV:CAC floor at about 3:1. But with the tightening market, this benchmark is being pushed upward. Investors in 2026 expect 4:1 or better, with top quartile companies running 4:1 to 6:1.
Rule of 40
The Rule of 40 is a simple test (revenue growth rate plus profit margin should clear 40%).
In 2025, 47% was the top-quartile bar (up two points from 2024). Top performers hit 47%, per High Alpha’s 2025 SaaS Benchmarks.
In Optimist’s work with B2B SaaS clients, we see a wide range of growth rates. But one common pattern generally emerges. The SaaS companies that have invested in compounding growth strategies like brand, thought leadership, inbound, and organic (SEO + AEO) tend to see more sustainable growth versus those that have invested primarily in direct acquisition through channels like paid.
Distribution Is the Only Moat in 2026
Product features stopped being a moat the moment AI-native competitors started shipping feature parity in months. The defensible path to growth being found and recommended (ideally, first) when a buyer is researching the category.
Whoever controls demand controls the category.
This means most SaaS companies are now investing considerably more in GTM than in the past — often 2x more than budget for product development.
Paddle’s 2025 framing puts the VC capital allocation shift bluntly. Five years ago, the rough split was 70% product spend and 30% go-to-market. Today the split is closer to 30% product and 70% distribution.
The harder data backs the framing. The median new CAC ratio is now $2.00 of S&M for every $1.00 of new ARR, according to ICONIQ’s 2026 Compass, roughly 2x the 2022 baseline. CAC payback at the median is up 12.5% since 2022. The unit economics on net-new acquisition are getting worse every year.
Distribution channels split into two broad categories.
Some decay. Some compound.
| Distribution channel | Cost trajectory | Pipeline durability |
|---|---|---|
| Paid acquisition (Google, LinkedIn, Meta) | Rising; B2B SaaS CAC up ~60% over five years | Stops the moment spend stops |
| Outbound (SDR, cold email) | Rising; falling reply rates break SDR economics at most ACVs | Linear with headcount |
| Organic discovery (SEO + AI answer engines) | Falling per dollar of ARR over time | Compounds; published content keeps producing |
| Community + word of mouth | Flat or falling per touch | Compounds slowly; durable but slow to scale |
B2B SaaS CAC is up roughly 60% over the past five years per Paddle’s ProfitWell research, and, at Optimist, we see the live version with founders watching CAC climb 30 to 50% year over year.
The conversation often leads to a similar conclusion. Paid turns into a tax on growth..
Strategy #1: Build the Organic Inbound Engine (SEO + AEO + Content)
Organic inbound is the only distribution channel that gets cheaper per dollar of ARR as a company scales.
In 2026, this means focusing on both traditional search and AI answer engines.
The math of organic inbound is uncontested.
Paid is getting more expensive and less effective at the same time. (Dreamdata’s analysis found B2B Google Ads CPC jumped 29% year over year to $5.34 while CTR fell 26%).
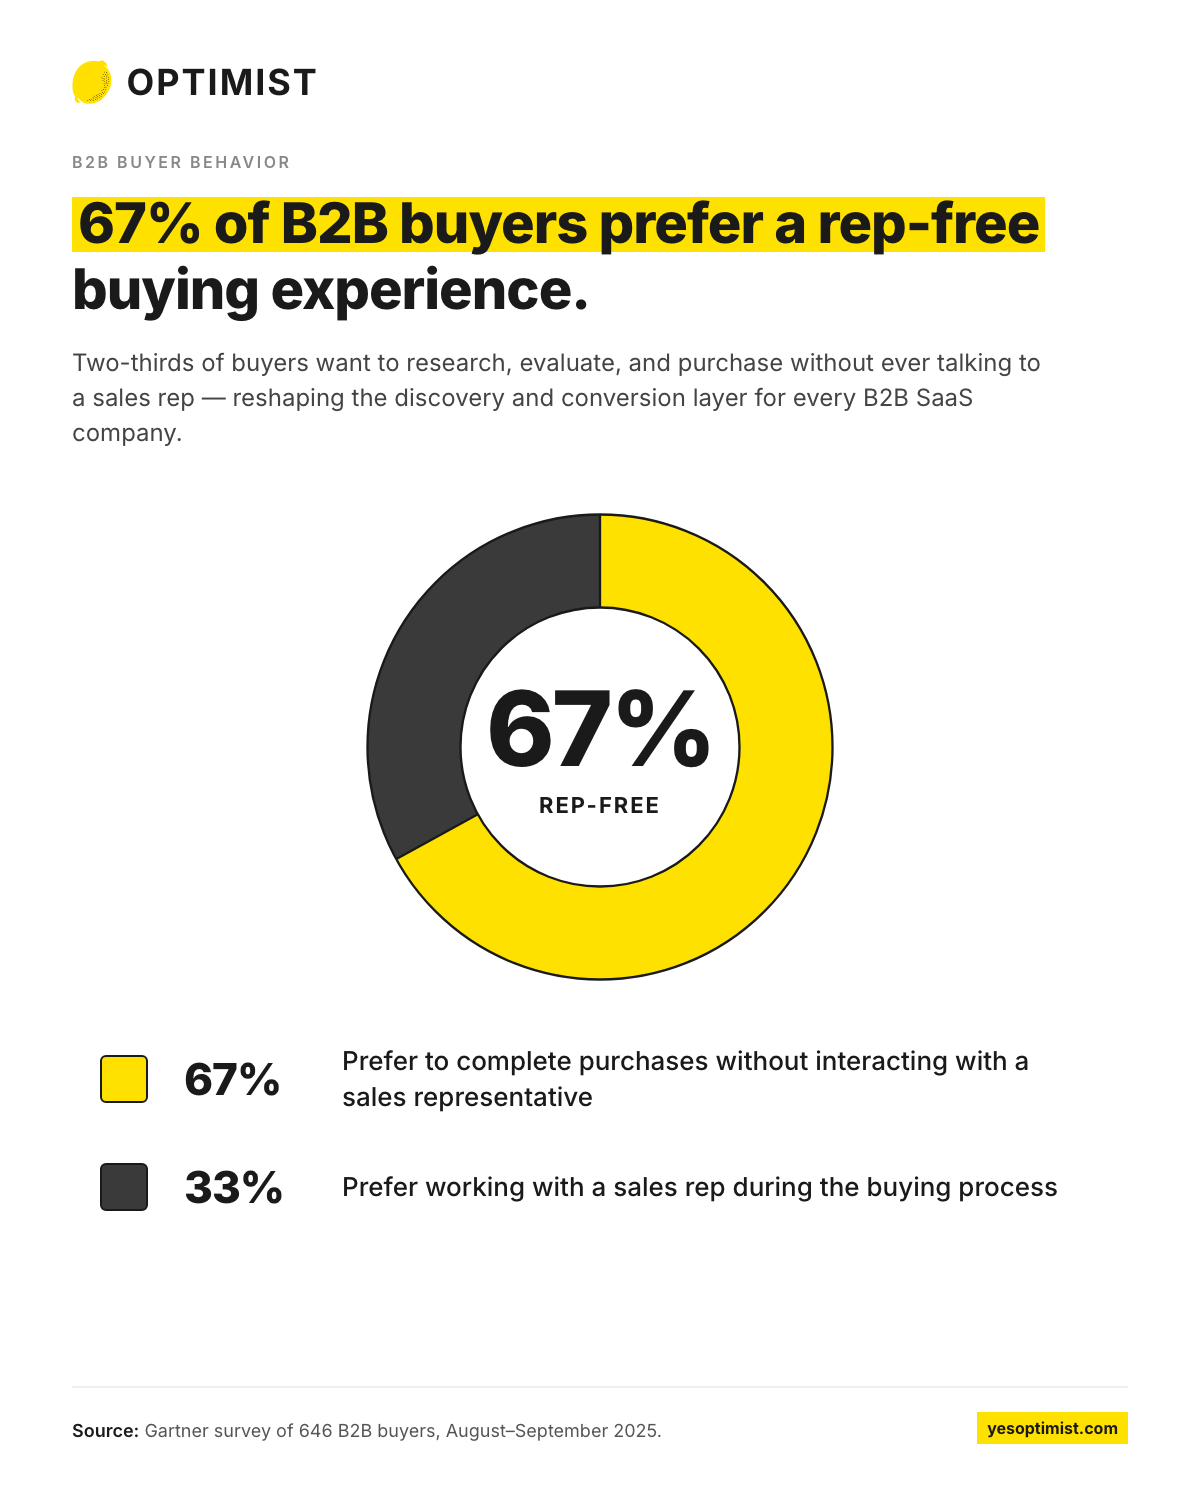
Meanwhile organic search still drives the majority of conversions across channels and Gartner found that 67% of buyers prefer a rep-free purchasing process. This means customers are discovering and evaluating your product entirely or almost entirely via your website, third-party sources, and through AI chatbots or LLMs.
The buying journey is tilted toward organic discovery.
This is only accelerating as buyer behavior changes.
According to Forrester’s Buyers’ Journey Survey 2025, 94% of B2B buyers used generative AI in their buying journey, up from 89% in 2024. Averi’s March 2026 multi-source analysis reports 73% of B2B buyers using AI tools in purchase research, drawn from analysis of nearly 3,000 buyers.
Buyers still use traditional search and they now also use LLMs and AI surfaces.
But, ranking in Google does not automatically mean getting mentioned in ChatGPT. Based on research from Ahrefs, only 8 to 12% of AI citations overlap with Google’s top-10 results.
This means building a complete organic growth strategy requires focus on both SEO and Answer Engine Optimization (AEO, also called GEO or AI SEO).
In Optimist’s work with B2B clients, we often see companies running organic and AI as two separate strategies that conflict and cannibalize.
We combine SEO and AEO into a system we call The Complete Organic Revenue Engine (CORE) Framework.

The core principle is deceptively simple:
- Build one unified dataset of every topic your buyers care about
- Analyze it through both the SEO lens and the AEO lens
- Optimize content for both simultaneously
Integration is the strategy.
This combined framework is the foundation of our content marketing strategies that have driven major growth outcomes for SaaS businesses for nearly 10 years:
- Stampli scaled inbound pipeline 5x
- Glide hit 14x product signups in a year
- Kubera reached 43x product signups in 15 months
- HelloSign’s growth led to a $230M Dropbox acquisition
But by adding AI search optimization, we’ve been able to drive major growth through AI surfaces and LLMs as well:
- 49x growth in LLM referral revenue for a B2B tech company in 14 months
- 8x LLM conversions in 8 months for a A fintech client
- 13x LLM-sourced revenue growth, year over year for a B2C/D2C retail brand
The takeaway is clear. Organic, inbound growth is still a massive lever for growing SaaS brands.
But it requires a new approach that has evolved beyond basic SEO practices.
AEO right now looks the way SEO looked in 2012. The companies that got serious early ate everyone else’s lunch for a decade. The same window is open in AI search, but it will close faster.
The companies declaring SEO dead are usually the ones that never built an SEO strategy that ties to pipeline.
Strategy #2: Engineer Pricing for Expansion, Not Just Acquisition
Pricing strategy is now an expansion-revenue lever, not just an acquisition lever.
The cheapest pipeline a SaaS company can generate is expansion within the existing customer base, and pricing is the mechanism that controls how much of it the product captures.
This model has shifted. Hybrid pricing, combining subscription and usage-based components, is now the median model in SaaS, with 48% of companies using it as the primary structure, per ICONIQ’s 2026 State of GTM. Consumption-based and usage-based structures are gaining meaningful ground. Flat-rate is no longer the default.
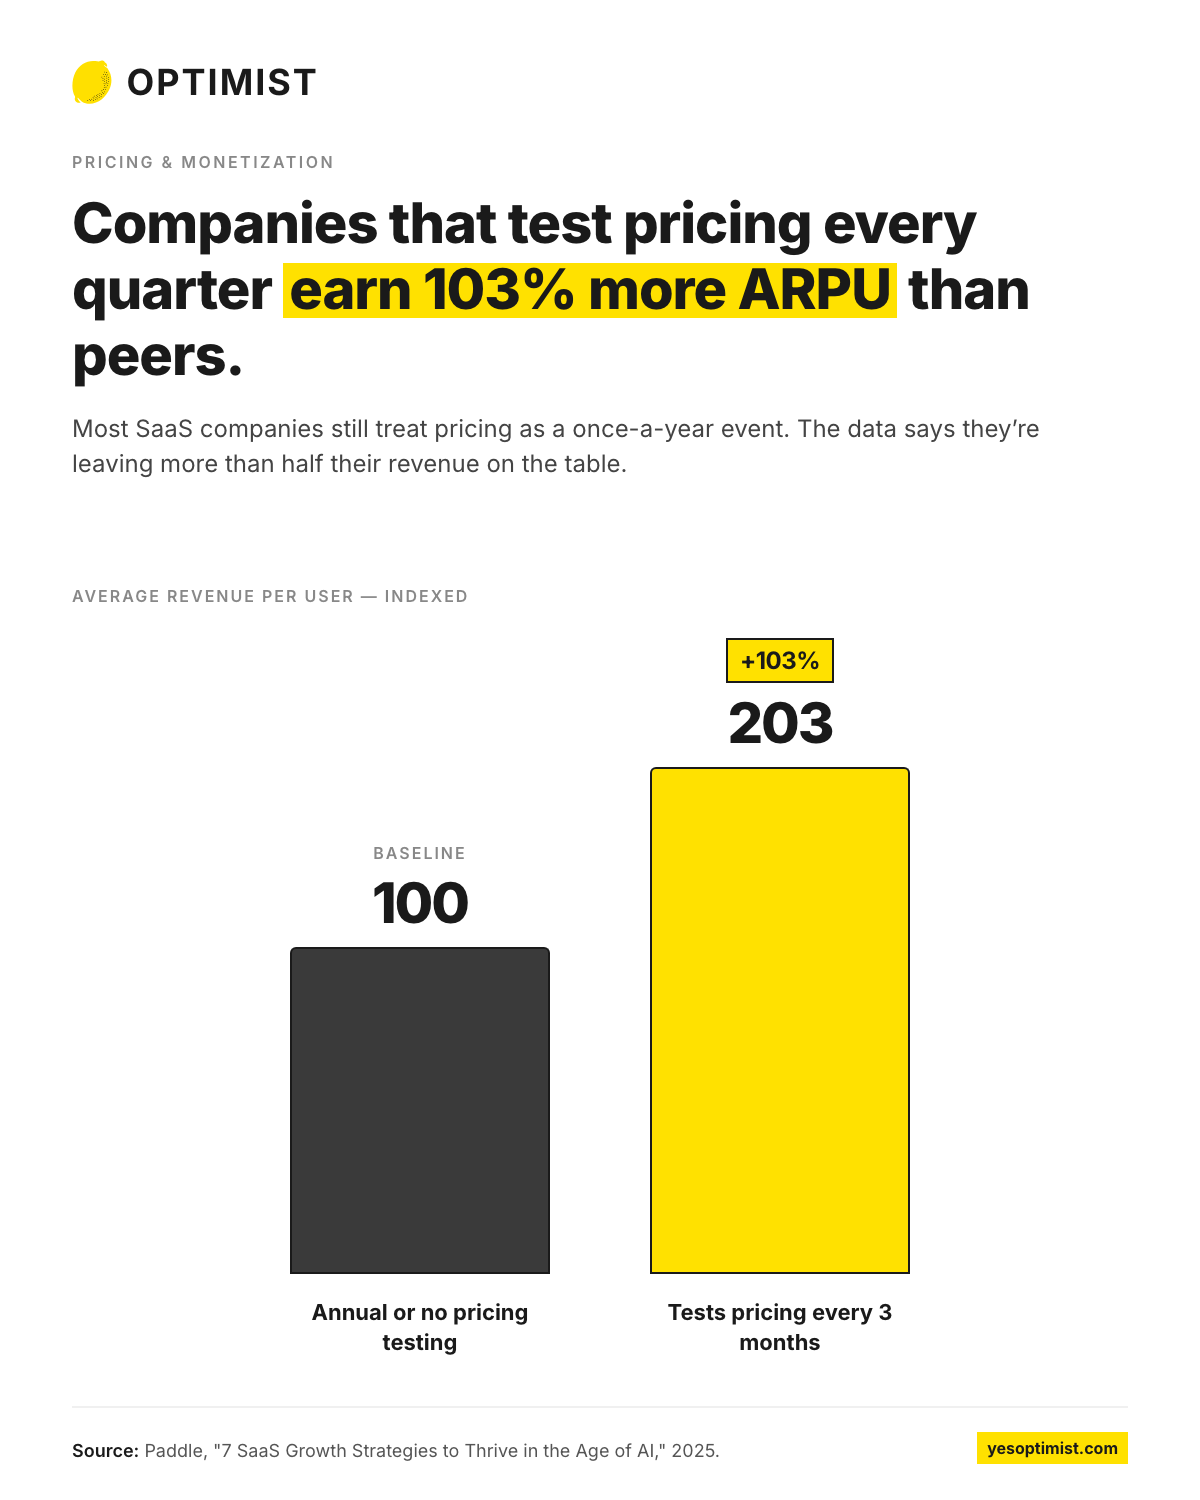
Most SaaS companies still treat pricing as a once-a-year event. But companies that test pricing at least every three months outperform on ARPU by 103%, per Paddle’s 2025 analysis.
The acquisition-versus-expansion split has tipped further toward expansion. The median company now generates 40% of new ARR from expansion, and companies above $50M ARR generate 58% or more, per Benchmarkit’s 2025 metrics report.
At scale, expansion is the dominant growth lever, and it’s dramatically cheaper than new-logo acquisition.
The PLG side of the pricing equation has its own benchmarks. Median free-to-paid conversion across PLG SaaS runs around 9%, per ProductLed’s PLG benchmarks. Opt-out trials, where users actively cancel rather than convert, hit 48.8% versus 18.2% for opt-in trials, per First Page Sage trial data.
Run a pricing test without breaking the model in four steps:
- Segment first. Run the test on a defined cohort (new signups, a specific plan, a single ICP segment) rather than the whole base. Existing customers stay grandfathered.
- Pick one variable at a time. Price level, packaging, value metric, billing frequency. Multi-variable tests are unreadable.
- Watch ARPU and conversion together. A 20% price lift that drops conversion 25% is a loss, not a win. The right metric is revenue per visitor, not list price.
- Hold the test long enough to see expansion behavior. First-month conversion data hides retention and expansion impact. Watch the cohort for at least 90 days.
Some of the fastest revenue lift opportunities can come from raising prices and clarifying who the product is for. Both move pipeline quality immediately because they tighten the ICP signal every other growth motion runs through.
Strategy #3: Run Product-Led Growth as a Pipeline Generator
Product-led growth works as a pipeline generator only when buyers can find the product in the first place. The discovery layer comes before the conversion layer.
The 2026 model isn’t pure PLG.
Again, it’s hybrid.
PLG companies grow roughly 2x faster than traditional sales-led peers. And tracking product-qualified leads increases the likelihood of fast growth by 61%, according to OpenView’s 2023 product benchmarks.
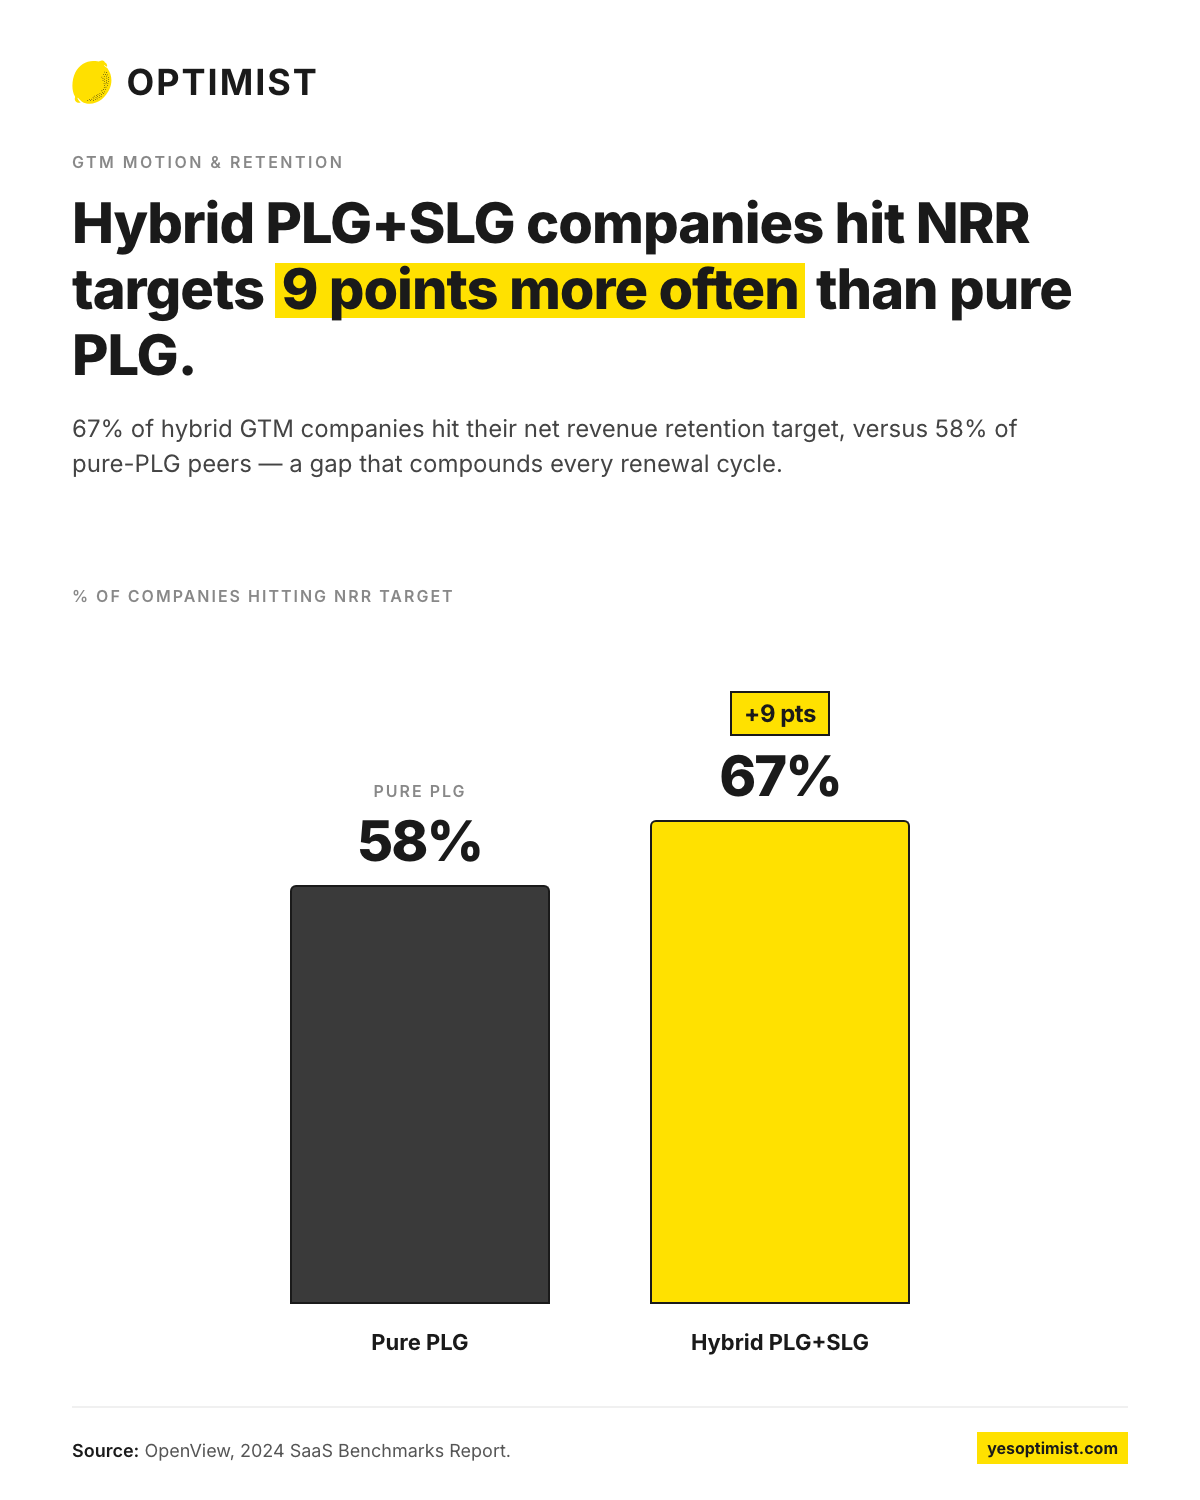
That data has evolved further in 2024 and 2025 benchmark data that show companies running hybrid (PLG + SLG) models are 9% more likely to hit NRR goals versus pure-PLG companies.
PQLs convert at higher rates than MQLs because the qualification signal is product usage, not a form fill.
ICONIQ’s 2026 State of GTM calls hybrid “the default,” with high-growth companies projecting roughly 20% self-serve revenue versus 10% at peers. The market has settled on PLG-led discovery, with sales-assist closing the high-ACV deals PLG alone won’t convert.
The right GTM motion depends almost entirely on average contract value. Here’s the working split most operators use:
| Average contract value | Primary GTM motion | Sales role |
|---|---|---|
| Under $5K ACV | PLG-led with self-serve checkout | None or light onboarding |
| $5K to $50K ACV | PLG with sales-assist | Help close, expand, and renew |
| Above $50K ACV | Sales-led with product-usage signals feeding pipeline | Owns full cycle; PQLs feed SDR routing |
PLG fixes the conversion problem. It does not fix the discovery problem. If buyers can’t find the product when they ask ChatGPT what to use, the free-trial conversion rate is irrelevant.
Optimist has audited PLG signups where the trial converts beautifully but only 4% of new visitors arrive from organic. The discovery layer is the bottleneck for most SaaS companies.
AEO and SEO are, fundamentally, an extension of the PLG motion.
AEO drives discovery to the point of free trial or signup. PLG drives adoption, conversion, and revenue.
Companies investing in PLG without strong distribution struggle to find traction as they remain invisible upstream, when buyers are researching their problems, evaluating potential solutions, building product shortlists, and comparing features and functionality.
Strategy #4: Treat Retention as the Highest-Margin Growth Channel
Retention is pipeline already paid for.
Letting it bleed is the most expensive form of new-customer acquisition.
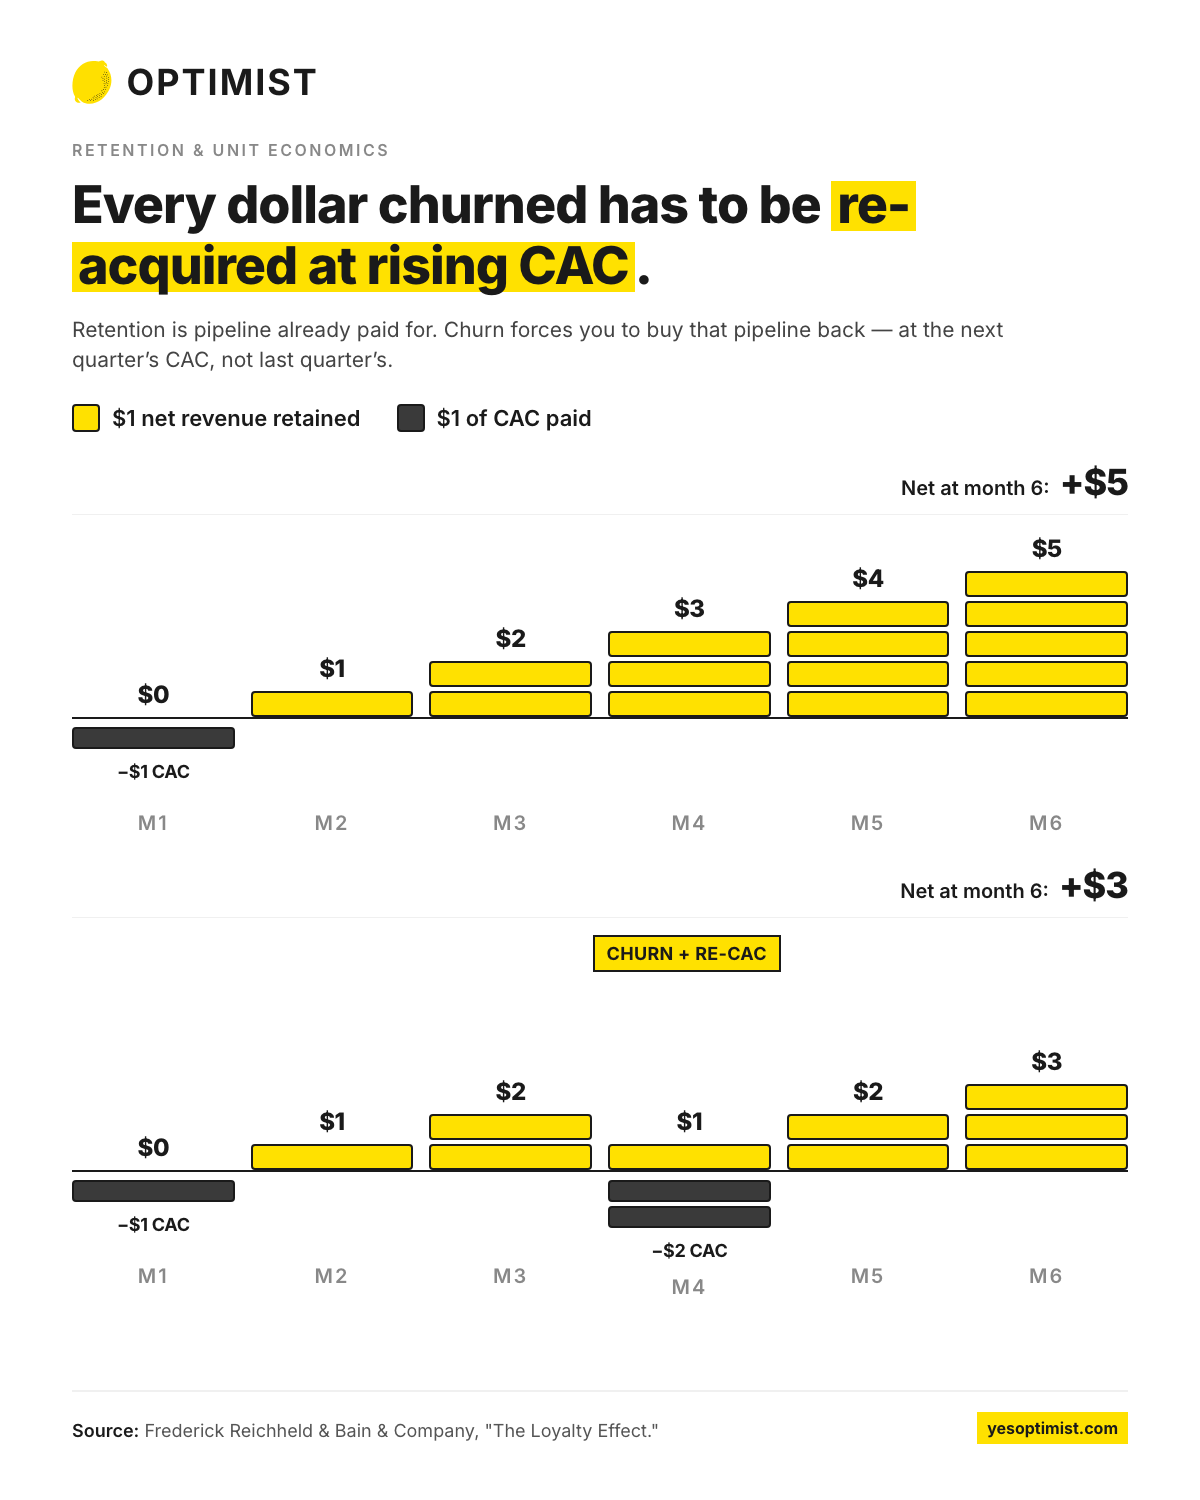
The unit economics make the case directly. A 5% increase in customer retention can lift profits 25 to 95%, per Bain’s classic retention research by Frederick Reichheld. Every dollar of ARR retained compounds over time. Every dollar churned has to be re-acquired at rising CAC.
The valuation math reinforces it. Best-in-class public SaaS NRR runs 120 to 125% and high-NRR SaaS companies grow 2.5x faster than their low-NRR counterparts, per High Alpha’s 2025 NRR analysis.
A 10-point improvement in NRR translates to a 20 to 30% valuation uplift, per m3ter’s 2026 analysis cited in FE International’s research.
On an $8M ARR business, that single metric shift can mean millions in exit value.
The highest-ROI retention play in most SaaS companies is fixing involuntary churn. Resolving failed payments with proper dunning, retry logic, and updated card-on-file flows can lift subscription revenue 8.6% in year one, according to Recurly’s failed-payments analysis.
It’s operational work, not strategic work, but it has the shortest payback of any retention investment.
The GRR-Adjusted Growth Math Doesn’t Lie
If a board is asking why pipeline is flat, the first place to look isn’t always top-of-funnel.
It’s the gross retention number.
A 92% GRR business growing 30% annually has a 38% gross-retention-adjusted growth rate, because eight points of revenue leaks out the bottom every year. Run the same math at 88% GRR and the picture gets uglier; that company posts a 42% adjusted growth rate, meaning twelve points of new ARR get eaten just to stand still.
The compounding effect is brutal, and it gets worse as the company scales.
Retention is more valuable than acquisition because retained ARR compounds across every billing cycle, while every churned dollar has to be re-acquired at rising blended CAC.
The Bain research above puts the profit lift from a 5% retention improvement at 25 to 95%. Companies with NRR above 120% generate the equivalent of organic growth without paying for a single new lead.
How to Choose the Right Strategy for Your Stage
There is no universal SaaS growth strategy. There is the strategy that compounds at the company’s specific ARR band, ICP, and ACV. Many growth plans fail because they layer motions before they really make sense. Or they’re trying to do too many things instead of focusing on excellence and efficiency in a few key motions.
The decision matrix below is the starting point Optimist uses with clients. It isn’t gospel; every company has wrinkles. But it captures the pattern across most B2B SaaS engagements.
| Stage / ARR | Primary growth motion | Secondary motion | Strategies to delay |
|---|---|---|---|
| Pre-revenue to $1M | PLG + product-market fit work | Founder-led content and community | Paid scaling, enterprise sales |
| $1M to $5M | PLG + organic content (SEO foundation) | Pricing iteration | Heavy outbound, ABM |
| $5M to $25M | Organic inbound (SEO + AEO) + hybrid sales-assist | Pricing optimization | Geographic expansion |
| $25M to $100M | Organic inbound + retention/expansion + ABM | Partnerships, AI ops investments | Brand-only spend |
| $100M+ | Retention/expansion + category creation + AEO defense | International expansion | New brand bets |
So, which one motion would compound the fastest if the company poured 12 months of focused investment into it?
The answer is almost never “all of the above.”
It’s one motion at the current stage, with a clear plan to layer the second once the first is producing.
A $5M ARR company running ABM on top of underbuilt content is solving the wrong problem. ABM works beautifully on top of strong organic visibility. Without it, the content the ABM campaign points back to has nothing to convert against.
Optimist’s CORE Analysis is how we help SaaS clients lay the foundation.
The CORE Analysis is a paid diagnostic that maps the AEO and SEO opportunity for a specific company and outputs a CORE Roadmap prioritized by pipeline impact.
Deliverables include a unified topic universe with pipeline values, an AEO benchmark across five AI models, a combined opportunity matrix with priority scoring.
In other words, it’s a clear, step-by-step plan for scaling organic visibility and discovery —
The Metrics That Tell You If Your Growth Strategy Is Working
A growth strategy is working if the company is moving on seven specific metrics.
The seven metrics that show whether a SaaS growth strategy is working:
- ARR growth rate vs. ARR-band median: Compare against the SaaS Capital benchmark for the company’s ARR tier, not the absolute number.
- NRR and GRR: Track both. NRR shows expansion efficiency. GRR shows the leak rate. Compute the gross-retention-adjusted growth rate to see what is actually happening underneath the headline number.
- CAC and CAC payback period: Median CAC payback is up 12.5% since 2022, per Benchmarkit’s 2025 metrics report. Target under 12 months. 24+ months reads as capital-inefficient.
- LTV:CAC: 4:1 or better is the 2026 investor expectation. Below 3:1 is a flag.
- Pipeline coverage ratio: Healthy is 3 to 4x quota. Below that, the sales team is missing because the funnel never had enough volume.
- Burn multiple: Net burn divided by net new ARR. Below 1.5x is healthy. Above 3x is dangerous in 2026 capital markets.
- AEO visibility metrics: Share of Model Response (how often the brand is named in answers to category prompts), citation frequency, and AI-source referral revenue. These are the AEO-native equivalents of SEO ranking and traffic.
If a marketing team reports traffic and MQLs without tying them to pipeline and revenue, that team doesn’t have a growth strategy. Shifting to pipeline reporting is the highest-leverage move most marketing leaders can make in their first 90 days, because it forces every downstream decision to be re-evaluated against the metric that matters.
Build Your Foundations First
The companies that compound through the next 24 months will not be the ones running ten growth motions in parallel. They will be the ones that picked one motion, invested 12 months of focused effort, and layered the second on top of a working foundation.
A simple test: Could the marketing team explain, in one sentence, which motion is supposed to compound for them and why?
If you’re looking for a foundation for your SaaS growth strategy that will compound over time and unlock new channels and tactics, let’s discuss your organic growth strategy.
Optimist’s Complete Organic Revenue Engine (CORE) Framework integrates SEO and AEO into one stack across the full funnel.
Pre-funnel discoverability and citability, top-of-funnel narrative control and problem anchoring, middle-of-funnel solution comparison, and bottom-of-funnel brand recommendation.
The system is built on a proven architecture we’ve used to drive scalable SEO and measurable AEO growth for high-growth SaaS clients over the last decade.
Let’s discuss your strategy and how we can help.
Schedule a free strategy call with Optimist today.
Frequently Asked Questions About SaaS Growth Strategy
What is a good growth rate for a SaaS company?
A good SaaS growth rate depends on the segment. Per SaaS Capital 2025 benchmark of 1,000+ companies, the overall median is 25%, with bootstrapped companies at 23% and equity-backed companies at 25%. Companies in the top NRR tier post median growth 83% above the population. Investors in 2026 anchor on the segment median, not a universal “good” number.
How do you scale a SaaS company?
Scaling a SaaS company means picking the one or two growth motions that compound at the company’s current ARR stage and investing 12 months of focused effort into them before layering the next. Stage-specific moves: PLG plus product-market fit under $1M ARR, organic inbound from $5M to $25M, retention and expansion above $25M. The decision matrix in this article maps the primary motion to each ARR band.
What is the difference between product-led and sales-led growth?
Product-led growth uses the product itself as the primary acquisition channel through free trials, freemium, and self-serve onboarding. Sales-led growth uses a dedicated sales team to identify, qualify, and convert leads. The 2026 dominant model is hybrid (enterprise sales blended with bottom-up entry points), which ICONIQ’s 2026 State of GTM describes as “the default.” Below $5K ACV, PLG-led is the default. Above $50K ACV, sales-led with product-usage signals feeding pipeline is the default.
How long does it take for a SaaS growth strategy to show results?
Most SaaS growth strategies show initial signal within 3 to 6 months and meaningful pipeline impact within 6 to 12. Pricing optimization moves the fastest, with measurable ARPU lift inside 1 to 3 months. PLG conversion improvements show inside 3 to 6 months as cohort data builds. Organic inbound (SEO and AEO) takes 3 to 6 months to produce meaningful pipeline, but compounds for years afterward. Retention improvements compound across the full LTV horizon, so the impact builds quietly for 12 to 24 months.
What is the most cost-effective SaaS growth strategy?
Organic inbound, including SEO, content, and AEO, is the most cost-effective SaaS growth strategy because it is the only motion that compounds. Per-customer cost on organic runs materially below blended paid CAC. Paid keeps getting more expensive every year. Organic gets cheaper per dollar of ARR as the content library compounds.
How is SaaS AEO different from SaaS SEO?
AEO is optimization for AI answer engines like ChatGPT, Perplexity, and Gemini. SEO is optimization for traditional search engines like Google and Bing. The two approaches have significant overlap and they’re both built on the same content and technical foundations. But ranking in Google does not automatically mean getting cited in ChatGPT (and vice versa). AEO is ultimately about optimizing for 2 goals: Increasing brand mentions and recommendations through content gap closure, entity disambiguation, and consistent positioning plus increasing citations through structural levers like FAQ blocks, schema, and content chunking.
